Blaze
A continuous network speed test with live visualization and history graph.
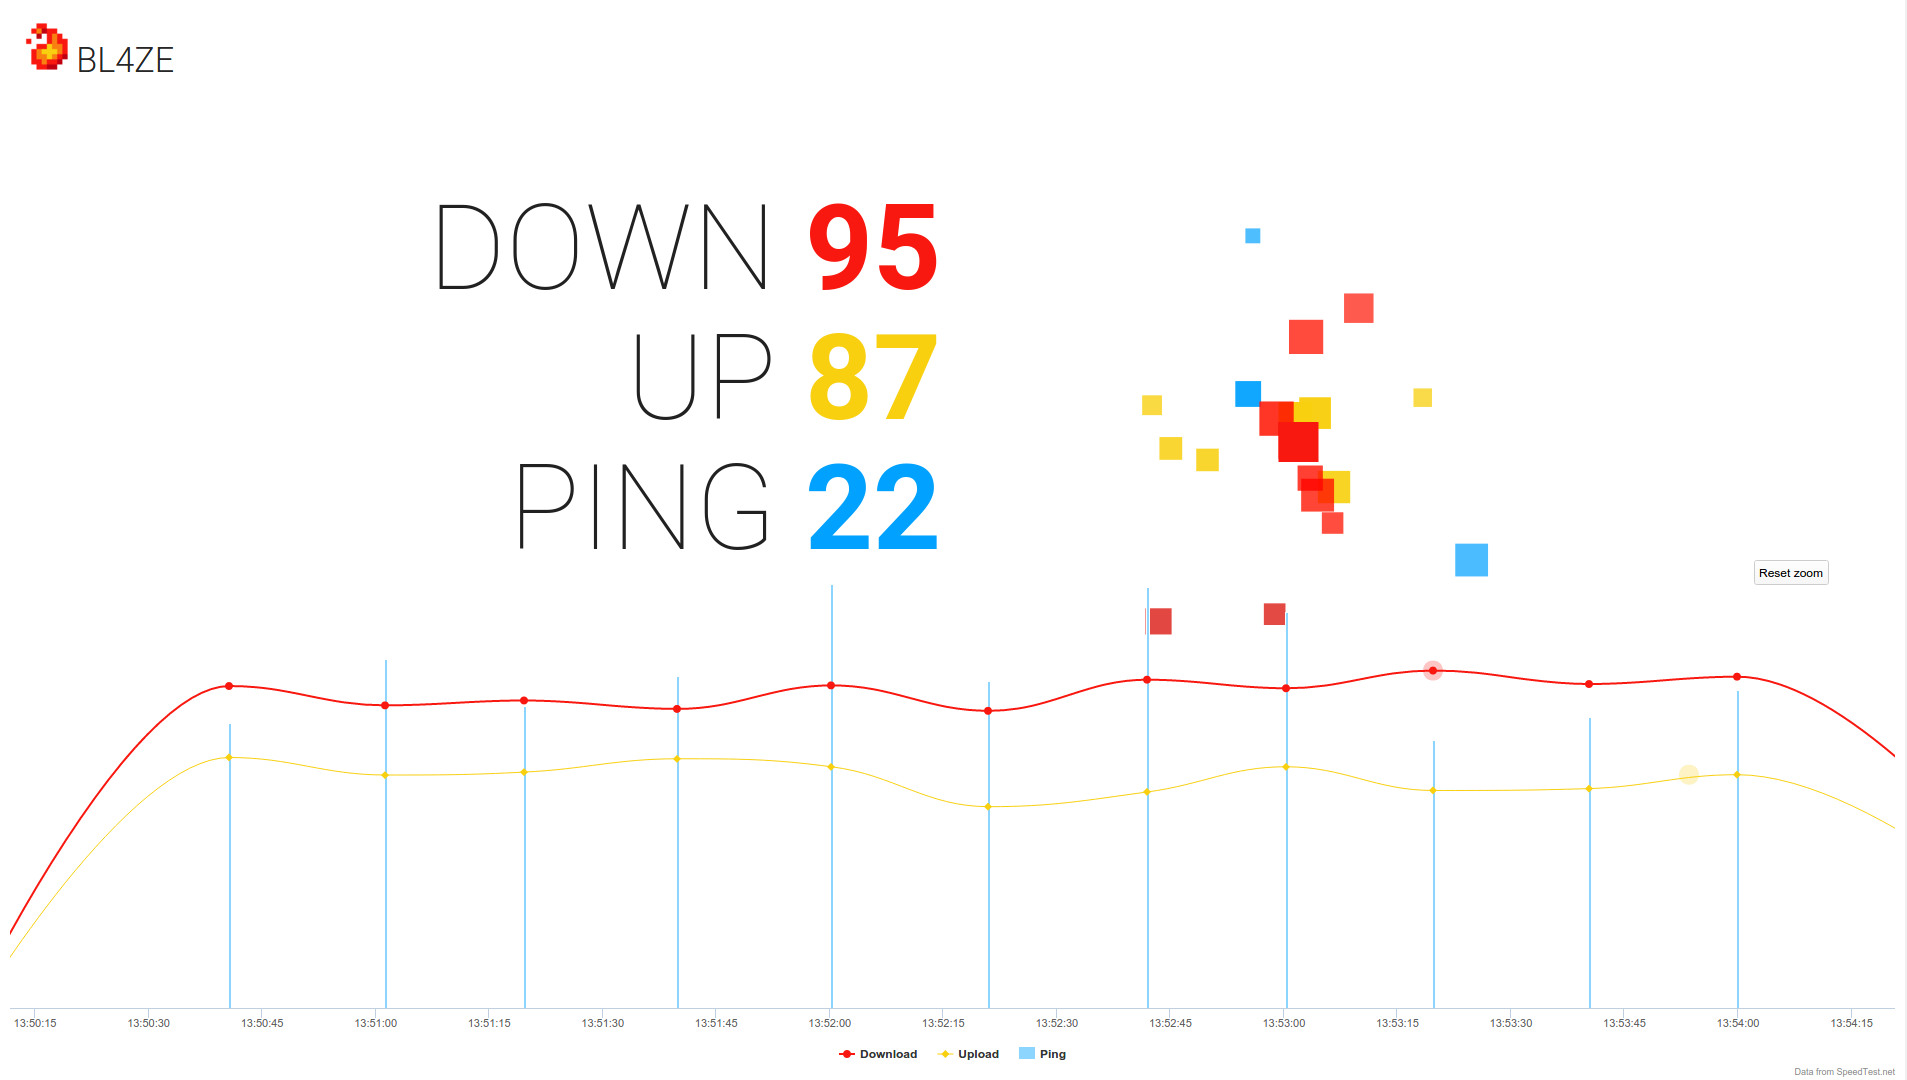
An entry for a coding competition to build the coolest speed test.
Blaze runs speedtest.net continuously from a Node.js logger and feeds the results into Highcharts plus a custom visualization, so you see both your current network speed and how it has behaved over time rather than a single number from a single moment.
Running it requires the Node logger running locally to measure your connection.